Dash Display System UI
A real-time dashboard interface designed for BU’s Formula SAE racecar, built to give the driver clear and immediate feedback during competition. The system displays speed, RPM, battery state, discharge rate, temperature, and g-force data using a custom visual layout optimized for readability at high speeds. I designed the UI through iterative sketches in Adobe Illustrator and Figma, then implemented it using HTML, CSS, and JavaScript with live sensor-data hooks for future integration with the car’s embedded systems.
Tech Stack: HTML, CSS, JavaScript (Canvas API), Python (Flask and data processing), STM32 data hook, Figma, Adobe Illustrator
Key Features:
- Dynamic battery status visualization with color-coded icons
- Support for real-time speed and RPM updates
- Support for live g-force indicator using HTML5 Canvas
- Warning system for battery level, discharge rate, and temperature
- Modular layout designed for high-speed readability
- Designed visually in Illustrator and Figma before implementation
- Future-ready hooks for sensor data via STM32 and API polling
Soft Skills:
- User Empathy / UX Awareness: Optimized the dashboard for drivers to ensure ease of use and enhance performance.
- User-Centered Design & Creativity: Applied iterative design methods in Illustrator and Figma to create a UI readable at high speeds.
- Leadership & Mentorship: Led a 6-person software team and guided new members in learning skills and contributing to the project.
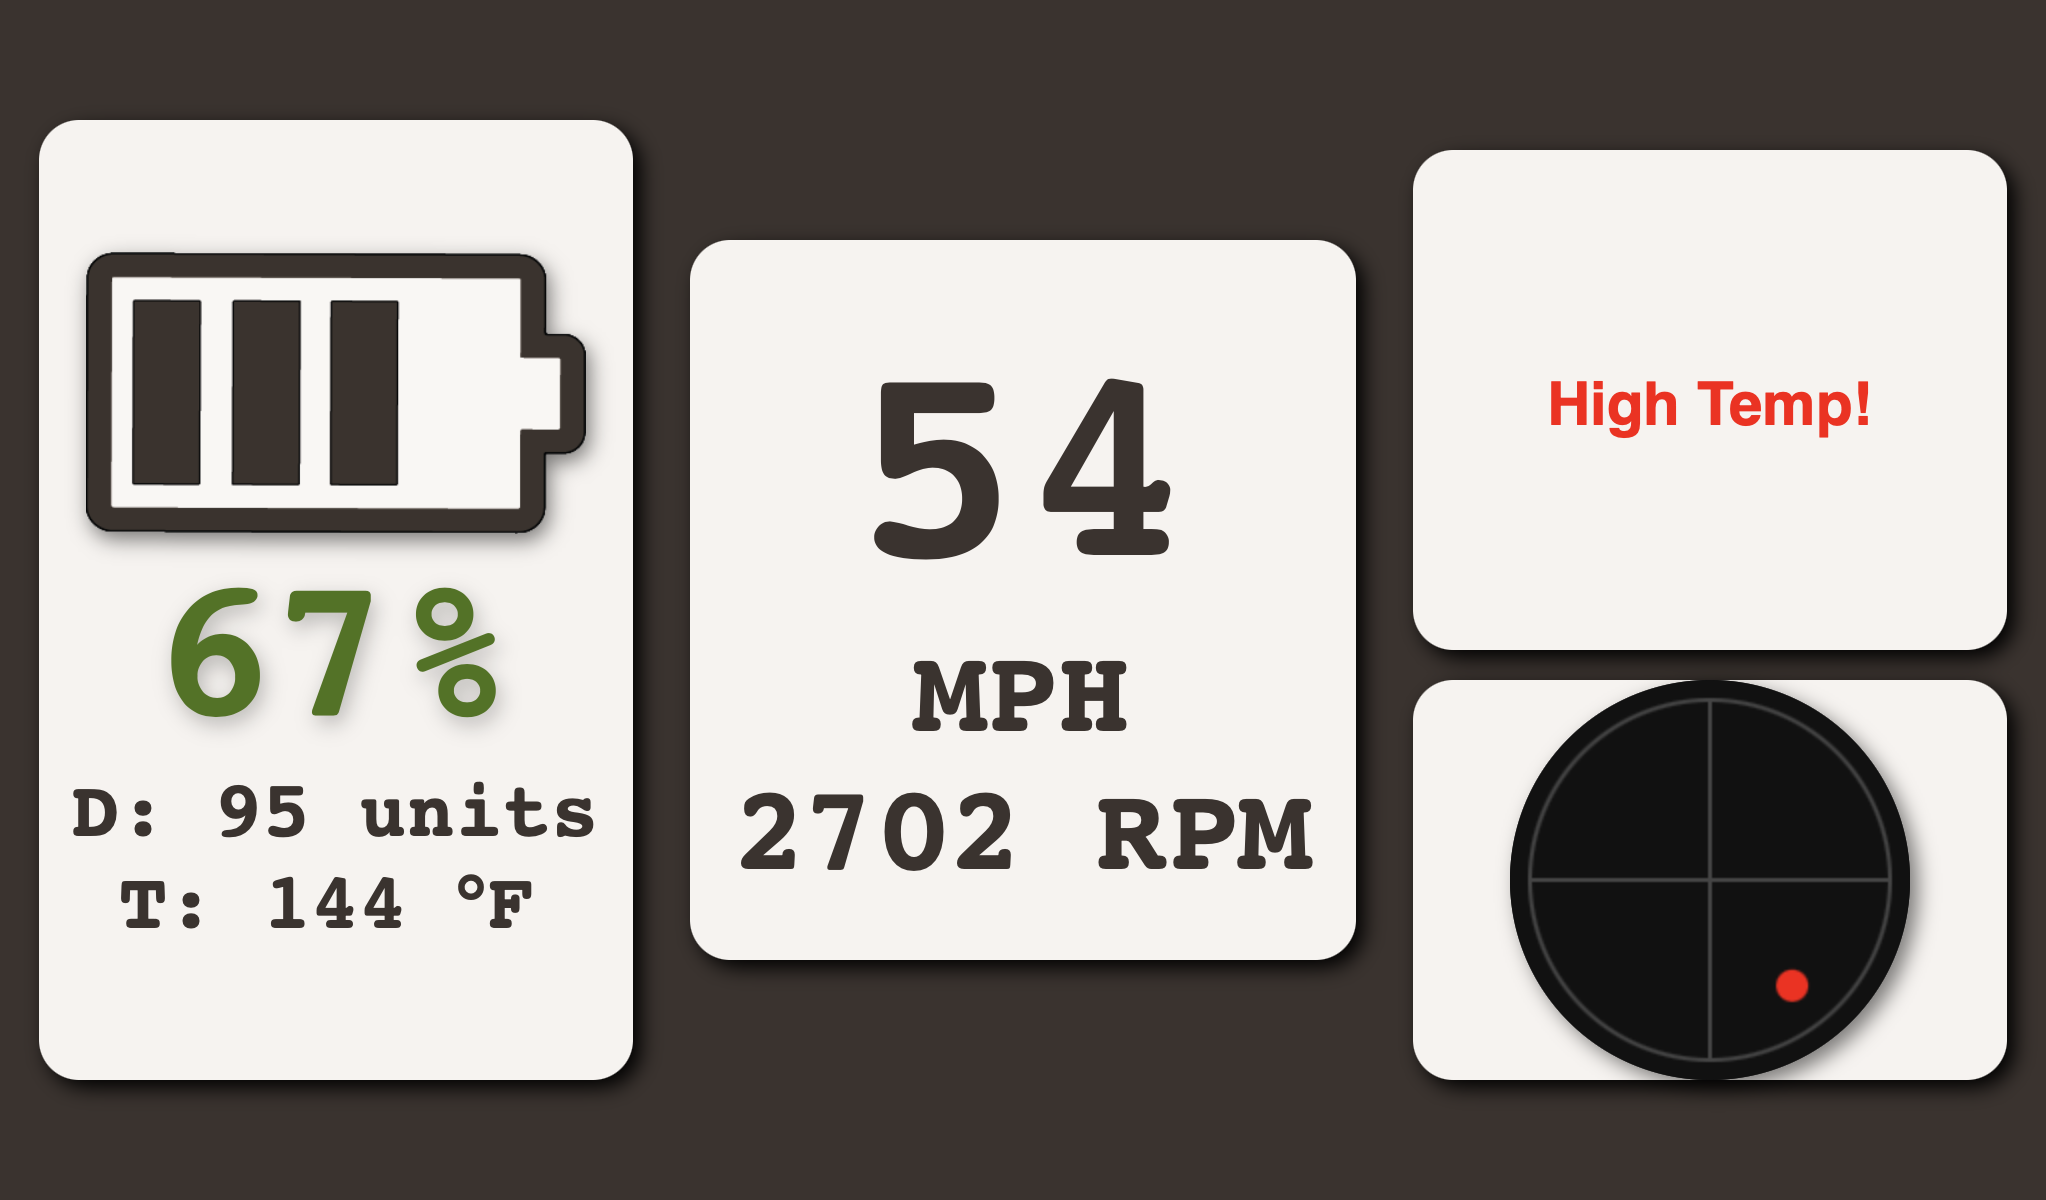
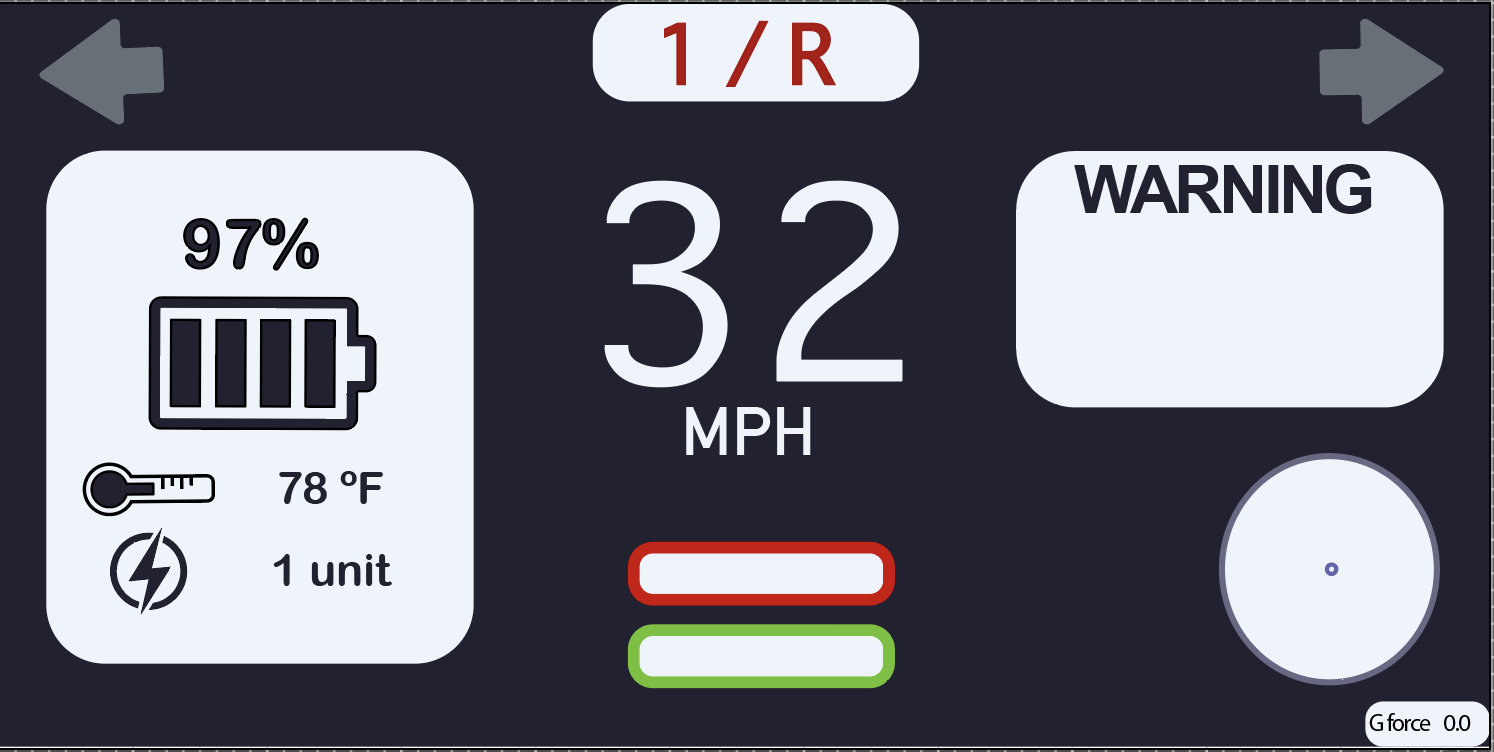
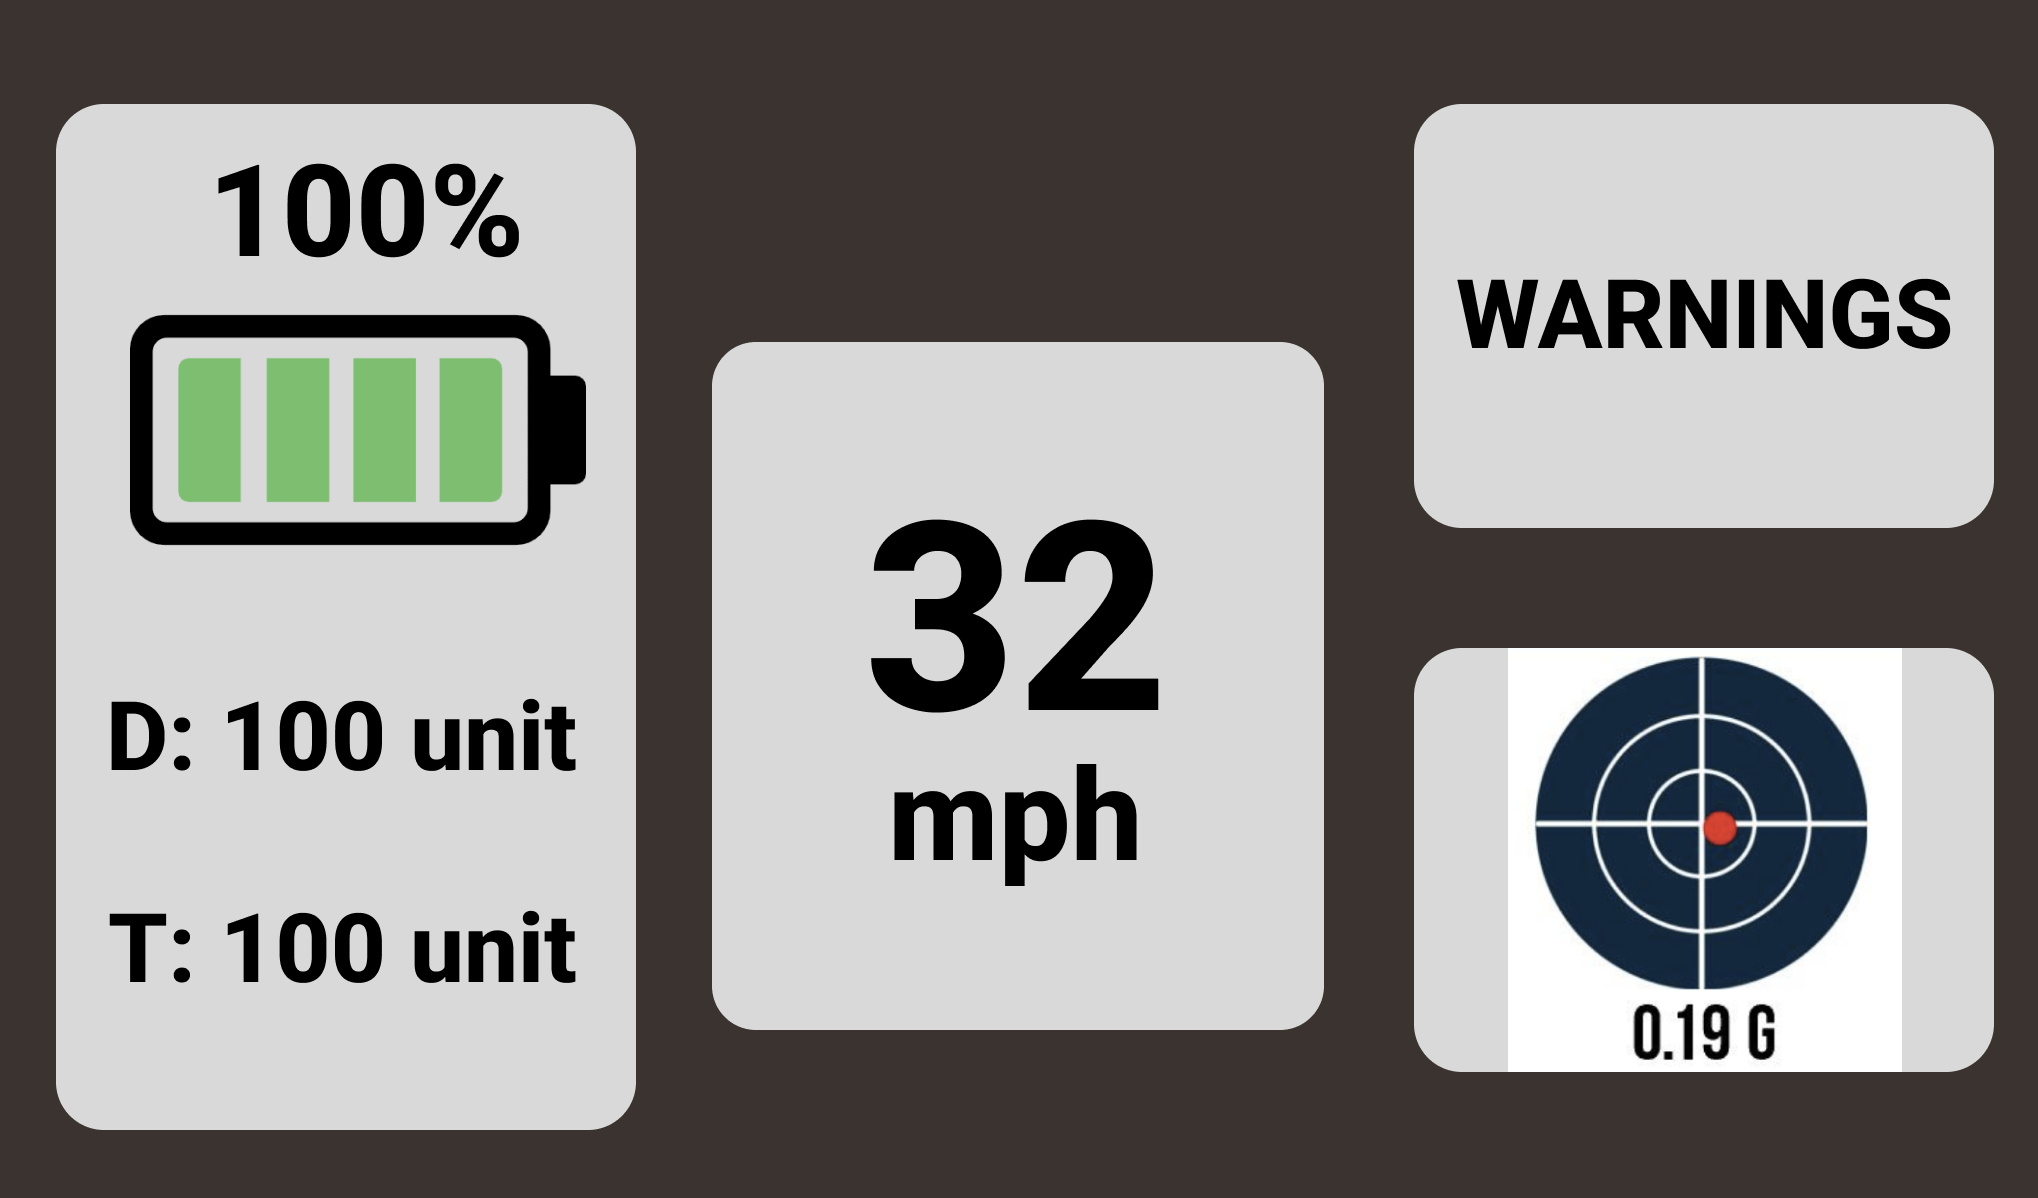
Associated App Screenshots
Sketch created in Adobe Illustrator for the 2024-25 DDS
Sketch created in Figma for the 2025-26 DDS